How to monitor memory usage of VM in Google Cloud ?
This tutorial guides you on how to monitor memory usage of VM in Google Cloud Platform. Let’s learn how to monitor Google Cloud Compute Engine virtual machine (VM) instance by installing Cloud Monitoring Agent.
Monitor memory usage of VM in Google Cloud
Before you start, make sure that you have created Google Cloud Project and enabled billing for your project.
Then, Go to Compute Engine and create a compute engine instance. You need to wait couple of minutes for your instance to launch and visible in VM instances page. Once the instance is launched then follow the below steps. Connect to VM through SSH option in the Google Cloud Console.
Update the package lists on your instance.
$ sudo apt-get update
Set up the Apache2 HTTP Server.
$ sudo apt-get install apache2 php7.0
Finally, install the cloud monitoring agent. To install the agent you need to follow the below instructions.
Add the agent’s package repository by running the following commands.
$ curl -sSO https://dl.google.com/cloudagents/add-monitoring-agent-repo.sh

$ sudo bash add-monitoring-agent-repo.sh
Now, install the cloud monitoring agent.
$ sudo apt-get install stackdriver-agent
Start the cloud monitoring agent.
$ sudo service stackdriver-agent start
Note, you can delete the installation script after agent is installed successfully.
Verify Cloud Monitoring Agent Status
Also, you can verify whether the cloud monitoring agent is working as expected by checking the agent’s status as shown below.
$ sudo service stackdriver-agent status

● stackdriver-agent.service - LSB: start and stop Stackdriver Agent
   Loaded: loaded (/etc/init.d/stackdriver-agent; generated)
   Active: active (running) since Tue 2021-03-30 04:48:07 UTC; 3min 39s ago
     Docs: man:systemd-sysv-generator(8)
    Tasks: 14 (limit: 4665)
   Memory: 9.4M
   CGroup: /system.slice/stackdriver-agent.service
           ├─10201 /opt/stackdriver/collectd/sbin/stackdriver-collectdmon -P /v
           └─10219 /opt/stackdriver/collectd/sbin/stackdriver-collectd -C /etc/
The status of the agent should be Active (Running)/ OK.
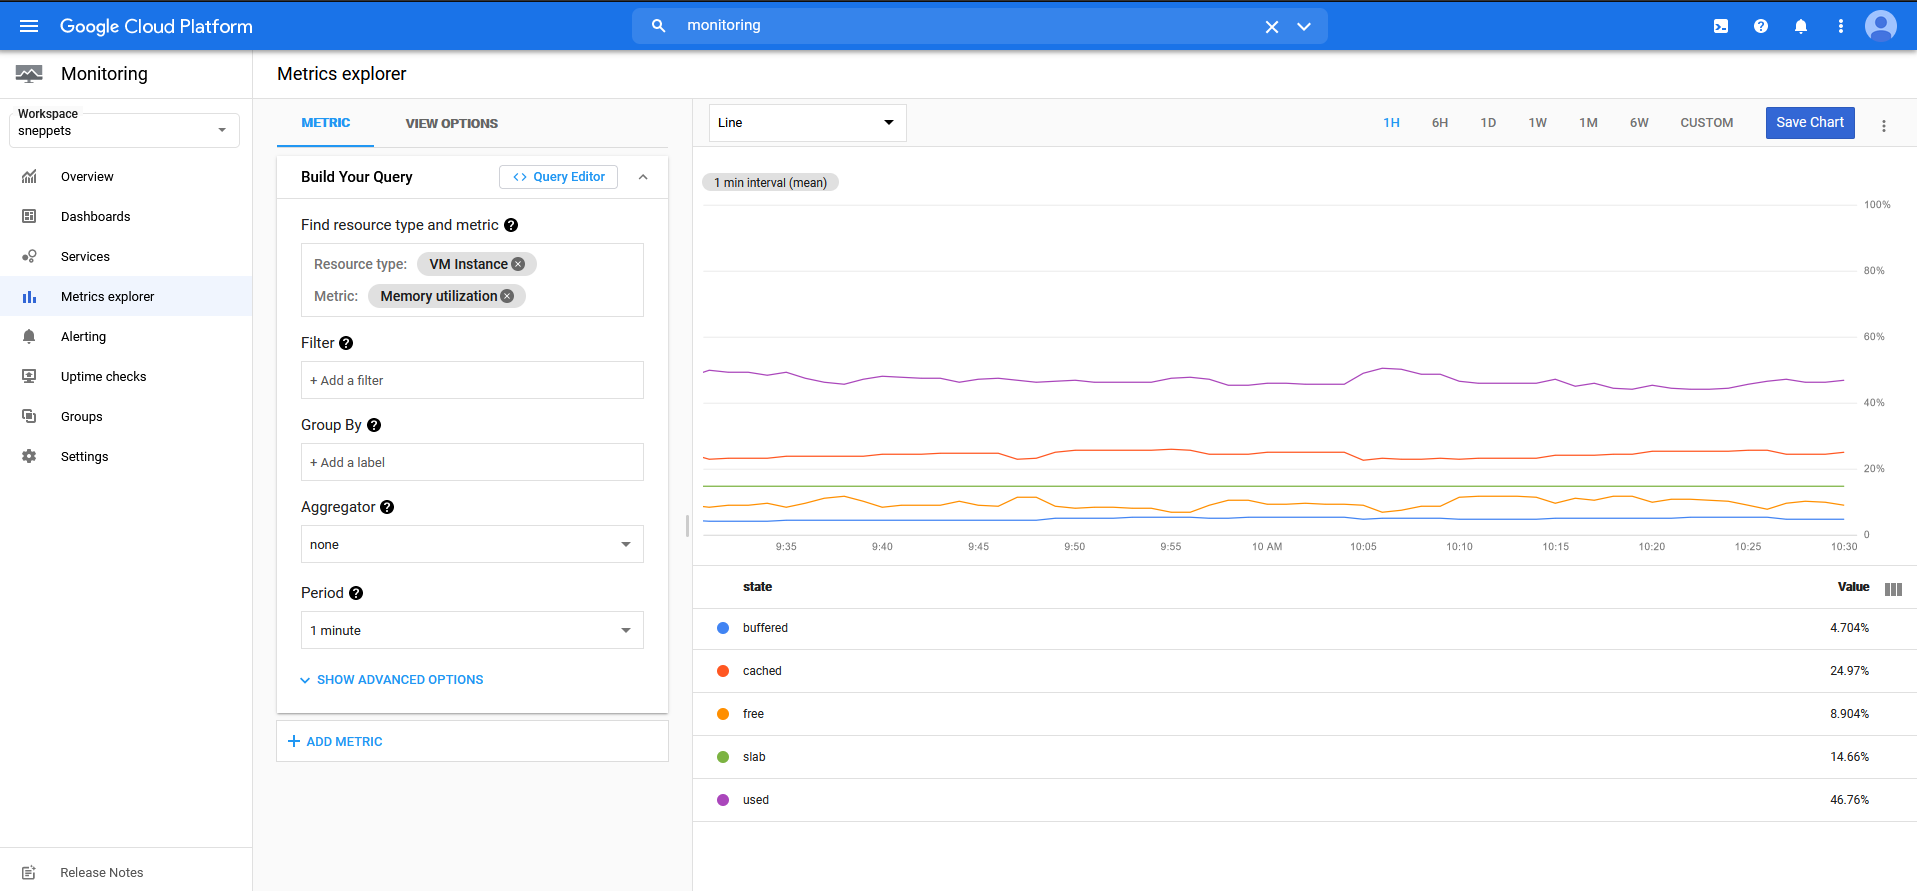
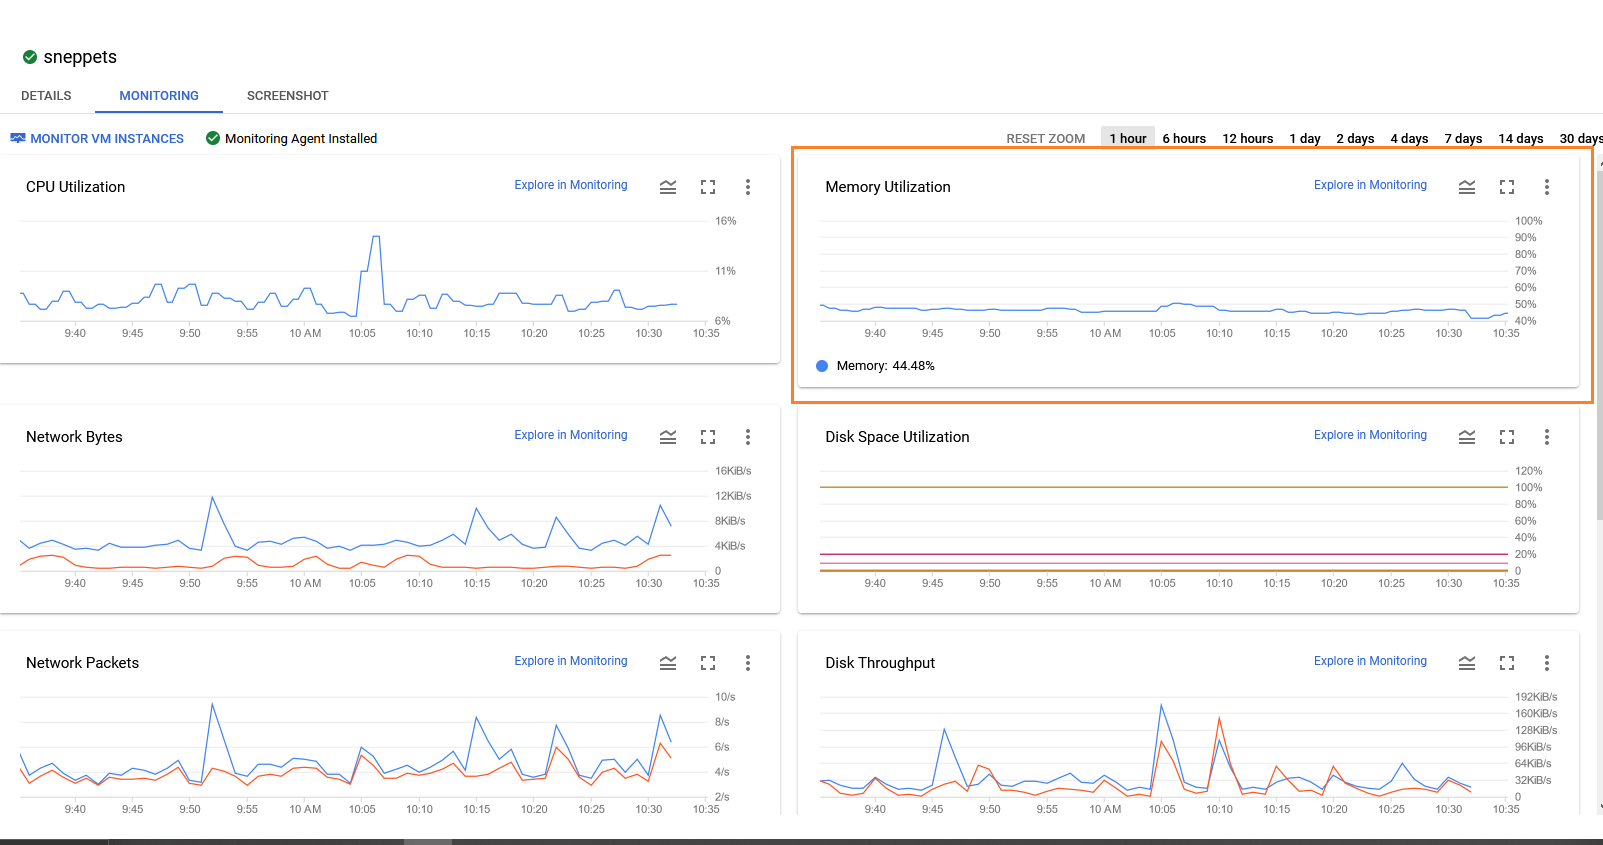
You can also check memory usage statistics using metrics explorer option in Monitoring feature of Google Cloud Platform.
Go to Monitoring -> Metrics Explorer and build your query as shown in the following picture.
You can also check memory utilization by navigating from VM instance page -> More actions -> View Monitoring as shown below.
Troubleshooting
You can also examine the logs and ensure there are no errors by running the following command.
$ sudo grep collectd /var/log/{syslog,messages} | tail
If you have any trouble in installing the cloud monitoring agent, I suggest you to try some of the things below.
For Linux VM, check whether agent service is up and running.
$ sudo service stackdriver-agent status
Suppose, if agent is not running then try restarting.
$ sudo service stackdriver-agent restart
If the restart fails, and the log output shows “Disabled via metadata”, you may be running an image from Marketplace, where the Cloud monitoring agent is disabled by default. Therefore, try enabling the agent and try reinstalling the agent.
Hope it helped 🙂
- How to Explore Docker Container’s File System ?
- Docker EXPOSE Port only to the Host on Google Cloud
- Get Docker Container’s IP Address from the Host
- Copy Files between Host and Docker Container
- What is ImagePullBackOff status on a Kubernetes pod ?
- Set or change root password in Ubuntu Linux
- How to list all Containers running in Kubernetes Pod ?
- How to find which users belongs to a specific group in linux
- Give write permissions for specific user or group for specific folder in linux
- How to remove an image tag from docker hub ?
- Build a Docker Image with a Dockerfile and Cloud Build in GCP?
- How to create GCP project on Google Cloud Platform
- MariaDB – How to set max_connections permanently ?
- Create GCP project on Google Cloud Platform
- Is it possible to change Google Cloud Platform Project ID ?
- Create non-root SSH user account and provide access to specific folders
- Make manual payment or pay early for your Google Cloud Platform charges
- View Kafka messages using kafka testclient
- Delete or unset clusters contexts and users entries from kubectl config


